A Comparative Evaluation of Intrusion-Alert Prediction Techniques
DSO National Laboratories, Singapore, tkianmoh@dso.org.sg
U.S. Naval Postgraduate School, 1411 Cunningham Road, Monterey, CA 93943, United States, ncrowe@nps.edu (contact author)
U.S. Naval Postgraduate School, United States, cjdarken@nps.edu
Defence Science and Technology Agency, Singapore, kfarnwei@dsta.gov.sg
Track: Network Security
Abstract—Recognition of patterns of intrusion alerts can permit prediction of future alerts and thus earlier countermeasures. Previous work has focused on building attack models to enable prediction, but this approach cannot handle novel attacks. We tested six methods of predicting novel alerts in what appears to be the first systematic comparison of their relative merits. The techniques were evaluated on real non-simulated attacks, both deliberately staged ones and those recorded by a honeypot. The best performance was achieved by an approach which exploits partial structural matching between time-grouped sets of alerts and finds analogies in them. This approach is slow in its basic form, but we found several methods to improve its speed.
Keywords: intrusion detection, prediction, alerts, analogy, learning
This paper appeared in the Proceedings of the International Conference on Security and Management, Las Vegas, NV, July 2014.
Network intrusion-detection systems [1] such as Snort [2] screen incoming packets for suspicious activities. They often recognize attacks only after they occur because they need strong evidence to keep their false-alarm rate low. That means that damage may already have been done when serious alerts are generated. Contextual alert prediction could enable a more anticipatory network defense. Attacks often generate multiple alerts and early alerts can provide strong clues as to what will happen next. Often intrusion-detection experts can see an alert cluster and use their intuition. With automation of such early warnings, anticipated additional rule sets could be loaded into a signature-based intrusion-detection system, or prior probabilities modified for more accurate Bayesian inference in an anomaly-based system. In this paper we describe previous work in alert and time-series prediction, describe six approaches to online intrusion-alert prediction, and report comparative tests of their performance.
Some previous work [[3]-5] predicted intrusion-detection alerts by correlating already-observed ones and matching the correlated sets against libraries of known scenarios. This approach requires modeling attacks in advance, and fails with deliberately novel adversary behavior. [6-[8]] addressed some limitations of this approach by using more general rules. [6] is probably the closest work to our approach to alert prediction with its approach of mining alert data to build attack graphs. [[9]] and [10] used Bayesian networks to learn correlations between alerts and conclusions about them using historical records, and [11] and [12] did something similar using Hidden-Markov models. Other work has addressed alert prediction for anomaly-based intrusion detection using state-transition models [13]. There appears to have been no work on reasoning by analogy for alert prediction, an idea important in artificial intelligence [14] that could inspire signature-based alert prediction that could learn dynamically as alerts come in.
Our previous work [15] developed a situation-learning approach to predicting relational time series in a role-playing game. Alert sequences can be seen as a time series of observations involving such properties as alert type, protocol, and IP addresses. Situation learning is an unsupervised online learning method that can flexibly learn with each new event.
We give a summary of the situation-learning methods we tested for prediction of alerts. See [16] for more details.
The prediction problem is defined as a1a2…ac |-af where ai are the alerts previously observed until the current alert ac, |- is the prediction operator, and af is the next future alert.
Each intrusion alert (such as from Snort) contains a rule identifier (ID), a set of attributes, and a time of occurrence. A time series of intrusion alerts is a time-ordered sequence of intrusion alerts. The current intrusion alert is the most recent alert.
A prediction is an expected intrusion alert at a future time. A prediction may have restrictions on time, space, and object. In this paper we primarily use the time restriction that the prediction must be the next event and the object restriction that it be an alert for one particular site. A predicted intrusion alert is said to be correct if the next intrusion alert that arrives matches it exactly in everything except time.
A sample alert sequence is given in Error! Reference source not found.I. The prediction problem here is, given alert a1 to a5, predict the next possible alert a6.
TABLE I. A sequence of five alerts
| Alert | time | Alert id | Source ip | Destination ip |
| a1 | 17:56:07.236 | 384 | 80.135.185.28 | 63.205.26.73 |
| a2 | 17:56:07.251 | 384 | 80.135.185.28 | 63.205.26.70 |
| a3 | 17:56:07.253 | 384 | 80.135.185.28 | 63.205.26.69 |
| a4 | 17:56:09.18 | 1256 | 80.135.185.28 | 63.205.26.69 |
| a5 | 17:56:09.557 | 1002 | 80.135.185.28 | 63.205.26.69 |
| a6 | ? | ? | ? | ? |
In this work, a situation S is defined as a collection of intrusion alerts that occur within a fixed-duration time window. Other definitions have been explored but this is the simplest and enables better comparison of prediction techniques. The current situation Sc is the situation that contains the most current intrusion alert ac as its last alert. A target alert at of a situation is the next alert that arrives after the situation. A situation-target tuple (S, {at}) is a pair of a situation and a set of target alerts for that situation.
Situation learning is an unsupervised learning technique that learns a set of situation-target tuples from a time series by sliding the time window forward as each alert arrives. As an example, for Table I before alert a5 is observed where ac = a4, we form the current situation S1 = {a1,a2,a3,a4}for a situation window duration of 2 seconds. When alert a5 is observed, a5 becomes the target of situation S1. If the situation–target tuple (S1,a5) already exists in our knowledge base, we only need to update its statistics. The alert a5 can also form a new current situation with the previous alerts that are within the 2-second time window. Note that when we compare situations or targets, we ignore the relative time of occurrence of each alert except for the Markov model. Situation learning has low complexity and is capable of learning from a relational time-series in a high-entropy, non-stationary, or noisy environment. Variations on situation learning can infer more complex targets such as an attacker’s intentions [17].
Given a set of situation-target tuples ![]() where Si ∈S, ti ∈T, S is a set of all previously encountered situations, T is the set of distinct alerts, and Sc is the current situation, the prediction problem seeks a situation-target tuple such that some matching function M(Si, Sc) is maximized. The ti or an inferred ti' can then be returned as the prediction. We tested six prediction techniques that cover reasonably well the space of possible prediction techniques.
where Si ∈S, ti ∈T, S is a set of all previously encountered situations, T is the set of distinct alerts, and Sc is the current situation, the prediction problem seeks a situation-target tuple such that some matching function M(Si, Sc) is maximized. The ti or an inferred ti' can then be returned as the prediction. We tested six prediction techniques that cover reasonably well the space of possible prediction techniques.
Exact matching (EM) looks for a situation-target ![]() such that Si=Sc. Since there may be multiple matching tuples each with a different ti, we select the target that has the highest probability given the situation Si. In implementation, the EM technique represents the set of situation-target tuples
such that Si=Sc. Since there may be multiple matching tuples each with a different ti, we select the target that has the highest probability given the situation Si. In implementation, the EM technique represents the set of situation-target tuples ![]() as a hash table, and searches the hash table for a situation that exactly matches the current situation ignoring times. EM prediction works well in stationary environments in which the same entities are often encountered such as same rule ID, same IP addresses, etc. It has more difficulty improving its performance if there are many instances of alerts with different IP addresses, protocols, and rule ids, and cannot make prediction when all alerts have not been encountered before. EM is fast because it just requires a hash lookup.
as a hash table, and searches the hash table for a situation that exactly matches the current situation ignoring times. EM prediction works well in stationary environments in which the same entities are often encountered such as same rule ID, same IP addresses, etc. It has more difficulty improving its performance if there are many instances of alerts with different IP addresses, protocols, and rule ids, and cannot make prediction when all alerts have not been encountered before. EM is fast because it just requires a hash lookup.
EM performance can be improved by replacing all constants except the rule ID with variables to permit more frequent predictions. We call this the Variabilized Matching (VM) prediction technique. The matching of two situations becomes the problem of variable matching though unification. A unification is a set of variable bindings, e.g. q(a, β)={a1:b1, a2:b2, …} where a distinct variable ai from situation α is bound to a distinct variable bj in situation β. Finding matches is equivalent to a graph isomorphism problem. Two situations match when there is a graph bijection (one to one unification) among the variables in both situations. VM prediction should find more matches than EM prediction when the number of new instances is higher because its matching criterion is less strict. The worst case time complexity of the variable matching technique is O(2nlog(n)) for two situations with same number of n constants [18]. But there exist many heuristics to speed up the graph isomorphism process by avoiding comparisons of two situations that are structurally different, such as number of constants (distinct IP addresses), predicates (rule ids), in/out degrees (source and destination), etc.
The structural matching problem encountered by VM’s graph isomorphism process can be relaxed to partial matching. We describe four such methods. First, Bayesian methods are popular ways to predict events, and were previously applied to intrusion event prediction in [9] and [10]. One Bayesian approach computes the probability of occurrence for each encountered target alert, conditioned on the set of alerts in the current situation. During learning, it constructs one Bayesian network for each distinct target alert. Each distinct alert is the parent node in its respective Bayesian network, while the alerts that appeared in the preceding situations are the child nodes. Since we have one Bayesian network for each distinct target, we have a multiple simple Bayesian networks prediction technique (MSB). To formalize this, let T be a set of distinct alerts and S be a set of situations. We assume alerts are conditionally independent to allow partial matching through the naïve Bayesian formalism. The probability of T, conditioned on S is:
![]()
![]()
![]()
where n is the number of alerts in the current situation, aj are alerts in the current situation.
To allow partial matching with MSB, where only a subset of events in a situation match a situation seen before, Laplace smoothing is used by adding 1 to the counts. In extreme cases, this does allow targets to be selected with no alerts in the current situation, but this should be rare. The time complexity of the MSB technique is O(n2) where n is the number of distinct alert events, but this only occurs when each distinct percept is a child of very other distinct percepts, which would be very unusual.
Simple Bayesian mixture (SBM) is an improvement over MSB that can learn functions such as exclusive-OR. We were curious whether it could improve upon MSB. SBM contains probability mixture densities, constructed by normalizing a linear combination of two or more Bayesian networks probability densities having the same parent and child percepts. In MSB, we have one distribution for one parent-child network. In SBM, the same distribution for one parent-child network is divided into several weighted distributions. SBM is implemented using the Estimate and Maximize algorithm.
The abovementioned prediction techniques ignore the order of events in the situations. Variable-order Markov model (VOMM) are the most popular way to predict ordered sequences, and were previously applied to alert prediction in [11] and [12]. VOMM is an extension to the Markov chain models in which a variable order is used in place of a fixed order. This means that the prediction of the target alert depends on a varying number of the most recent alerts such that the matching function thinks is best.
While the Bayesian and the Markov techniques can handle partial situation matching, the abovementioned techniques except for VM can only predict target alerts whose exact combination of parameters have been encountered before. However, the VM technique requires full graph isomorphism, which is rare in non-stationary domains. Its generality can be improved with partial variabilized matching (PVM), implemented as a subgraph isomorphism process instead of a full graph isomorphism. This idea is related to reasoning by analogy, and our approach to implementing it was inspired by the psychological theory of single-scope blending [19]. Since solving a subgraph isomorphism problem is central in PVM, we explored heuristic algorithms to do it with a time complexity of O(n2). The idea is to generate a score for all possible pairings between attributes in two situations based on similarities in constants, in-degrees, and out-degrees. We do a lexical sort of the pairs and greedily choose the best remaining pairs where none of the constants in the pair have been selected previously.
In the experiments that follow, we collected alerts sequences and ran the prediction algorithms on them. Each prediction technique returned their best prediction on the next alert to be triggered. The predicted alert is said to be correct if the next percept matches on rule ID, protocol, source IP address, and destination IP address. Note that time prediction is not included. A given situation can have multiple possible predictions, and their number varies considerably over techniques. To make comparison fair, each technique was compared on their best guess for the next event.
We used two metrics to measure performance of prediction: accuracy and computation time. Prediction accuracy was computed as c/n where n is the number of alerts received and c is the count of correct predictions. Computation time was the time to predict all alerts in the relational time series.
We compared the metrics in two kinds of experiments: explicitly generated attacks and live network traffic on a honeypot.
Experiment 1 used the penetration-testing tool Pytbull (pytbull.sourceforge.net) to generate attacks on an isolated two-machine network [20]. Attacks went from a host machine to a victim machine, with Snort for intrusion detection on the victim with port mirroring, as described in [20]. We used VMWare Player 4 to implement three virtual machines on the attacker and three virtual machines on the victim, as well as to facilitate restoration of system state. The victim virtual machines had 512 MB of memory and 14 GB of disk space.
Pytbull provided about 300 tests in 11 testing modules of badTraffic, bruteForce, clientSideAttacks, denialOfService, evasionTechniques, fragmentedPackets, ipReputation, normalUsage, pcapReplay, shellCodes, and testRules. We excluded some client-side attacks and pcap-replay attacks that our previous experiments had shown could not be detected by Snort [2]. We used Snort 2.9 with the free public rules since they are a de facto standard, and ran it on a Linux machine. We also put on the victim the Apache2 Web services, Vsftpd, SSH, and the BackTrack security analysis tool.
Tests with staged attacks may not be representative of real-world threats. Thus our primary experiments were with alert sequences obtained from the honeynet setup described in [21]. This honeypot was situated outside our school’s firewall on a network provided by a commercial Internet service provider. Three sequences were collected in 2012 from Internet traffic trying to connect to the honeynet. The honeynet had five virtual machines. Some active responses to attackers were provided as described in [22], but they almost entirely affected the quantity and not the content of the traffic, as discussed there. A summary of the first two and primary datasets is given in Table II. The counts on distinct alerts ignore the time attribute of the alerts. The repetition rate is the ratio of distinct alerts to the entire alerts. We use entropy to measure the uncertainty of the occurrences of alerts, computed as:
![]()
where p(xi) is the probability of alert xi.
TABLE II. Alert counts of Datasets 1 & 2
|
| Total Alerts | Distinct Alerts | Repetition Rate | Entropy | Duration |
| DataSet1 | 6482 | 1590 | 4.08 | 7.46 | 8 weeks |
| DataSet2 | 9619 | 4304 | 2.23 | 11.08 | 2 weeks |
A sequence of alerts will have a lower entropy if it contains alerts that have a high frequency of reoccurrence (e.g., many ping alerts). A low-entropy alert sequence is expected to be easier for prediction task since its repetition rate is high. A high-entropy sequence will be harder to predict since it has high count of new alert encounters.
We extracted the rule ID, protocol, source IP address, and destination IP address. A sample sequence is given in Error! Reference source not found.III. To more easily apply subgraph isomorphism algorithms, each alert was converted into an arity-2 representation. The time window was fixed at 0.1sec to keep the situations small, although a bigger window may better model complicated attack profiles.
TABLE III. Sample alert sequence from Snort network intrusion-detection system
To give a sense of the data, Table IV shows the histogram of the full set of alert descriptions for alerts occurring in the datasets. We did nothing to encourage particular types of attacks, so mostly we saw quite-familiar Internet attacks. This was to demonstrate our prediction methods could help in defending ordinary computer systems.
In the first experiment, the overall average prediction accuracies for all six prediction techniques for three attackers, three victims, and four prediction methods were similar at around 80%. PVM lead in prediction accuracy, followed by VOMM, MSB, VM, SBM and EM [20]. (Results with one attacker and one victim were similar, as were results with staggered attacks.) We grouped alerts into groups by alert type and computed the entropy for each group. The alerts were then sorted into six ranges of entropy as shown in Figure 1. The F-score is the harmonic mean of the precision (fraction of correct predictions of all predictions) and recall (fraction of correct predictions of all alerts). EM and VM were omitted because they are special cases of PVM.
TABLE IV. Histogram of alerts in the two datasets
| Attack | Count |
| ICMP PING | 3250 |
| ICMP Destination Unreachable Host Unreachable | 2488 |
| POLICY Outbound Teredo traffic detected | 1604 |
| SHELLCODE x86 inc ecx NOOP | 490 |
| SHELLCODE x86 NOOP | 396 |
| SPECIFIC-THREATS ASN.1 constructed bit string | 219 |
| NETBIOS DCERPC NCACN-IP-TCP ISystemActivator RemoteCreateInstance attempt | 79 |
| ICMP traceroute | 50 |
| ICMP PING *NIX | 44 |
| RPC portmap mountd request UDP | 38 |
| ICMP Destination Unreachable Protocol Unreachable | 19 |
| NETBIOS DCERPC NCACN-IP-TCP umpnpmgr PNP_QueryResConfList attempt | 12 |
| WEB-IIS WEBDAV nessus safe scan attempt | 6 |
| ICMP PING Flowpoint2200 or Network Management Software | 2 |
| POP3 PASS format string attempt | 1 |
| WEB-CLIENT Microsoft wmf metafile access | 1 |
| NETBIOS SMB-DS repeated logon failure | 2786 |
| ICMP Echo Reply | 1977 |
| ICMP Destination Unreachable Port Unreachable | 1555 |
| SHELLCODE x86 inc ebx NOOP | 454 |
| ICMP Time-To-Live Exceeded in Transit | 282 |
| NETBIOS DCERPC NCACN-IP-TCP srvsvc NetrPathCanonicalize overflow attempt | 144 |
| NETBIOS DCERPC NCACN-IP-TCP lsassDsRolerUpgradeDownlevelServer overflow attempt | 60 |
| ICMP PING Windows | 48 |
| ICMP PING BSDtype | 44 |
| WEB-CGI awstats.pl configdir command execution attempt | 22 |
| DNS SPOOF query response with TTL of 1 min. and no authority | 13 |
| ICMP PING Sun Solaris | 8 |
| SHELLCODE base64 x86 NOOP | 6 |
| SPYWARE-PUT Trackware funwebproducts mywebsearchtoolbar-funtools runtime detection | 2 |
| NETBIOS Microsoft Windows SMB malformed process ID high field remote code execution attempt | 1 |
We observe that when the entropy was less than 3, the F-scores for all prediction techniques are similar. This is because when the alerts repeat frequently, prediction is easier. However, when the frequency of occurrence reduces (or entropy increases), prediction performance began to differentiate, with PVM having the most accurate prediction accuracy. Paired T-tests comparing F-scores supported the hypothesis that PVM was the best with a 95% confidence level. However, the mean time to generate a prediction by PVM was 0.2207 seconds, whereas that for SBM was 0.0389 seconds, VOMM 0.0108 seconds, and MSB 0.0170 seconds. Similar results were obtained with one-at-a-time attacks and single-attacker single-victim setups.
Figure 1. Results of Experiment 1 with a penetration-testing tool as a function of entropy range
The engineered attacks in the previous experiment had many low-entropy alerts because there were only six IP addresses and limited types of attack. So we also tested data from a honeypot [16].
Figure 2 shows the variation of the average prediction accuracies over alert events for the honeypot data. After initial variations, predictors’ performance reached steady states. For data 1 (two weeks of alerts) the PVM achieved a prediction accuracy of around 70% while most settled around 55% and SBM was around 35%. For dataset 2 (eight weeks of alerts), The PVM achieved a steady state prediction accuracy of around 48%, VM 37%, VOMM and MSB 28%, and EM 25%. SBM was excluded from this experiment onwards because its prediction accuracies were poor in the previous experiments and its run time was significantly longer than the other techniques. It appears that its poor performance is due to the non-stationary environment in which data is insufficient to create a mixture of more than one distribution.
These percentages are considerably less than those of intrusion-detection systems, as alert prediction is a harder problem. But even with imperfect success, prediction can tell intrusion detection what to anticipate and this can save it significant effort and make its conclusions more reliable.
We examined the types of errors made by each method and concluded that the success of PVM was due to its greater flexibility in making predictions with limited data. The limited numbers of identical alerts in our datasets did not provide VOMM and SBM with sufficient statistics on events to make reliable inferences.
To study the effects of entropy on prediction, we partitioned a third dataset that had over a year of data with 200,000 alerts into 10 sequence of 20,000 alerts. To study the effect of shorter alert sequence (higher entropy), we also partitioned the first part of the data into 150 sequences of 100 alerts (Figure 3). PVM performed the best on both short and long sequences, but its advantage over the others was less on longer sequences.
Error! Reference source not found.V illustrates a key advantage of PVM: It can predict single-occurrence alerts that Markov and Bayesian methods cannot. For instance, row one of Error! Reference source not found.IV says of 2800 alerts that occured once, PVM correctly predicted 618 even before seeing any instance of them. Error! Reference source not found.VI shows some examples of Snort alerts that occurred once and were correctly predicted by PVM but not the other methods.
Figure 2. Dataset 1&2: Prediction accuracy with respect to the number of events (percepts). SBM for Dataset 2 is excluded.
As a more detailed example to show why this is so, suppose that our knowledge base contains only one situation target tuple of (alertID, source, destination) where S1 = {(384, 80.135.185.28, 63.205.26.69), (1256, 80.135.185.28, 63.205.26.69)} and T1= {(1002, 80.135.185.28, 63.205.26.69)}. Let the current situation be Sc = {(384, 80. 135.185.29, 63.205.26.70), (1256, 80.135.185.29, 63.205.26.70)}. Suppose that the system has encountered five alerts (384, 80.135.185.28, 63.205.26.69), (1256, 80.135.185.28, 63.205.26.69), (1002, 80.135.185.28, 63.205.26.69), (384, 80.135.185.29, 63.205.26.70) and (1256, 80.135.185.29, 63.205.26.70). Note that the S1 and Sc have some commonalities; both contain one alert of ID 384 and one alert of ID 1256. Furthermore, the source IP address 80.135.185.28 of S1 can be associated with the source IP address 135.185.29 of Sc since both IP addresses appear as source IP addresses in two alerts in their respective situations. Similarly, 63.205.26.69 can be associated with 63.205.26.70. We want to predict the next alert from the target alert by substituting the target IP addresses with those found in the current situation after the association process. We want the prediction to be (1002, 80.135.185.29, 63.205.26.70), something not observed before.
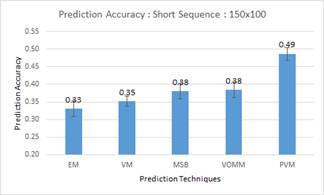
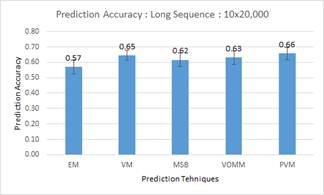
Figure 3. Average prediction accuracies for shorter versus longer sequences on the third dataset
TABLE V. Comparative prediction performance as a function of the number of occurrences of an alert
| Frequency of occurrence | Number of Alerts | PVM Detects | MSB Detects | VOMM Detects |
| 1 | 2800 | 618 | 0 | 0 |
| 2 | 2403 | 1847 | 707 | 574 |
| 3 | 174 | 107 | 107 | 62 |
| 4 | 285 | 250 | 218 | 250 |
| 5 | 29 | 10 | 11 | 12 |
| 6 | 56 | 46 | 35 | 38 |
| 7 | 22 | 12 | 6 | 9 |
| 8 | 18 | 14 | 10 | 12 |
| 9 | 11 | 8 | 7 | 8 |
| 10 | 11 | 8 | 8 | 8 |
The main disadvantage of PVM was that it was slower than the other methods since it requires subgraph matching, and its speed disadvantage increased with the number of situations it stores. Hence, it is imperative to keep either the situation size or the time window small. One simple way to improve computation time was to eliminate old or low-utility situation-target tuples. Figure 4 illustrates the effect of eliminating all but the best 10% of the number of possible situations from consideration, including only the most recent and occur more often. Experiments showed that the prediction accuracy did not decrease significantly but the computation time was reduced significantly. Decreasing the maximum situation size from 2000 to 200, for instance, only decreased accuracy from 0.55 to 0.54 while increasing speed by a factor of 10.
TABLE VI. Snort alerts predicted by SSB but not by MSB, SBM, and VOMM
|
| Protocol | Source | Destination |
| 12710, ASN.1 constructed bit string | TCP | external | honeypot |
| 402, Destination Unreachable Port Unreachable | ICMP | honeypot | external |
| 3397, DCERPC NCACN-IP-TCP ISystemActivator RemoteCreateInstance attempt | TCP | external | honeypot |
| 408, Echo Reply | ICMP | honeypot VM 1 | external |
| 402, Destination Unreachable Port Unreachable | ICMP | honeypot | external |
| 1390, x86 inc ebx NOOP | TCP | honeypot VM 2 | external |
| 384, PING | ICMP | external | honeypot VM 3 |
Figure 4. Effect of situation elimination on computation time with number of events encountered
There are also many heuristic methods for improving the speed of subgraph matching since it is needed in many applications of artificial intelligence. We got best results by a heuristic method of ranking match options by the strength of their similarity so that the most-similar ones were tried first, then conducted something close to a best-first search. It was not a strict best-first search because we got better performance when we included additional "second-best" options on the best-first agenda. The final performance improvement using this idea alone was around a factor of 10, with significantly more improvement for high-entropy data.
The criterion for evaluating prediction accuracy so far has been stringent: Whether the next percept matches the prediction. If we relax the criterion to allow prediction of the percept within a time window, testing of the prediction would seem fairer in busy network traffic. We conducted experiments with a window of two standard deviations beyond the mean time of next occurrence of a percept. Results showed that prediction performance was surprisingly worse by around 1%, with VM 5% worse. This appeared to be due to the large variety of distinct alerts, for which it takes time to obtain sufficient occurrences of an alert to derive a good estimate of the statistical time interval of occurrences. Therefore, the intervals are usually zero, which require predicted alerts to occur exactly at the exact time of occurrence. As a result, prediction within an output time window becomes even more stringent than with next-event prediction.
Prediction of alerts can provide earlier responses to cyber-attacks and enable better recognition of attacks that are truly novel. Relational time-series learning and prediction methods provide useful new ideas for predicting intrusion alerts. They offer a special advantage in that they do not require an attack model in advance, which gives them flexibility in real-time response to traffic. In this work we tested several approaches with Partial Variable Matching (PVM) performing the best. On short alert sequences or those with high entropy, the superiority of PVM was more pronounced. PVM (and VM as well) also have the advantage of being able to predict new alerts, which can be useful in the dynamic world of frequent new cyber threats.
This opinions expressed are those of the authors and do not represent the Singapore or U.S. governments.
[1] Trost, R.: Practical Intrusion Analysis. Upper Saddle River, NJ: Addison-Wesley, 2010.
[2] Roesch, M.: Snort—Lightweight Intrusion Detection for Networks. In: Proceedings of LISA ’99: 13th Systems Administration Conference, 1999, pp. 229-238.
[6] Li, Z.-T., Wuhan, J., Wang, L., Li, D.: A Data Mining Approach to Generating Network Attack Graphs for Intrusion Prediction. Proc. Fourth Intl. Conf. on Fuzzy Systems and Knowledge Discovery, Haikou, CN, pp. 307-311, August 2007.
[10] Tabia, K. and Leray, P.: Handling IDS’ Reliability in Alert Correlation. Proc. Intl. Conf. on Security and Cryptograph, Athens, GR, pp. 1-11, July 2010.
[11] Zan, X., Gao, F., Han, J., and Sun, Y.: A Hidden Markov Model Based Framework for Tracking and Predicting of Attack Intention. Proc. Intl. Conf. on Multimedia Information Networking and Security, Hubei, CN, pp. 498-501, November 2009.
[12] Fava, D., Byers, S., and Yan, S., Projecting Cyberattacks through Variable-Length Markov Models. IEEE Transactions on Information Forensics and Security, Vol, 3, No. 3, pp. 359-369, September 2008.
[13] Soule, A., Salamatian, K., and Taft, N.: Combining Filtering and Statistical Methods for Anomaly Detection. Proc.5th ACM SIGCOMM Conference on the Internet, pp. 331-344, 2005.
[14] Winston, P.: Learning and Reasoning by Analogy. Communications of the ACM, Vol. 23, No. 12, pp. 689-703, 1980.
[15] Tan, K., Darken, C.: Learning and Prediction in Relational Time Series. In: Proceedings of Behavior Representation in Modeling & Simulation, 2012, pp.100-107.
[16] Tan, T.: Learning and Prediction of Relational Time Series. Ph.D. dissertation, U.S. Naval Postgraduate School, Monterey, California, USA, March 2013.
[17] Qin, X., and Lee, W.: Attack plan Recognition and Prediction Using Causal Networks. Proc. 20th Computer Security Applications Conference, pp. 370-379, December 2004.
[19] Fauconnier, G., Turner, M.: The Way We Think: Conceptual Blending and the Mind's Hidden Complexities. New York: Basic Books, 2002.
[21] Albin, E., Rowe, N.: A Realistic Experimental Comparison of the Suricata and Snort Intrusion-Detection Systems. In: Proc. of Eighth International Symposium on the Frontiers of Information Systems and Network Applications, Fukuoka, Japan, March 2012.